Tracking Economic Growth Across High-Income Nations
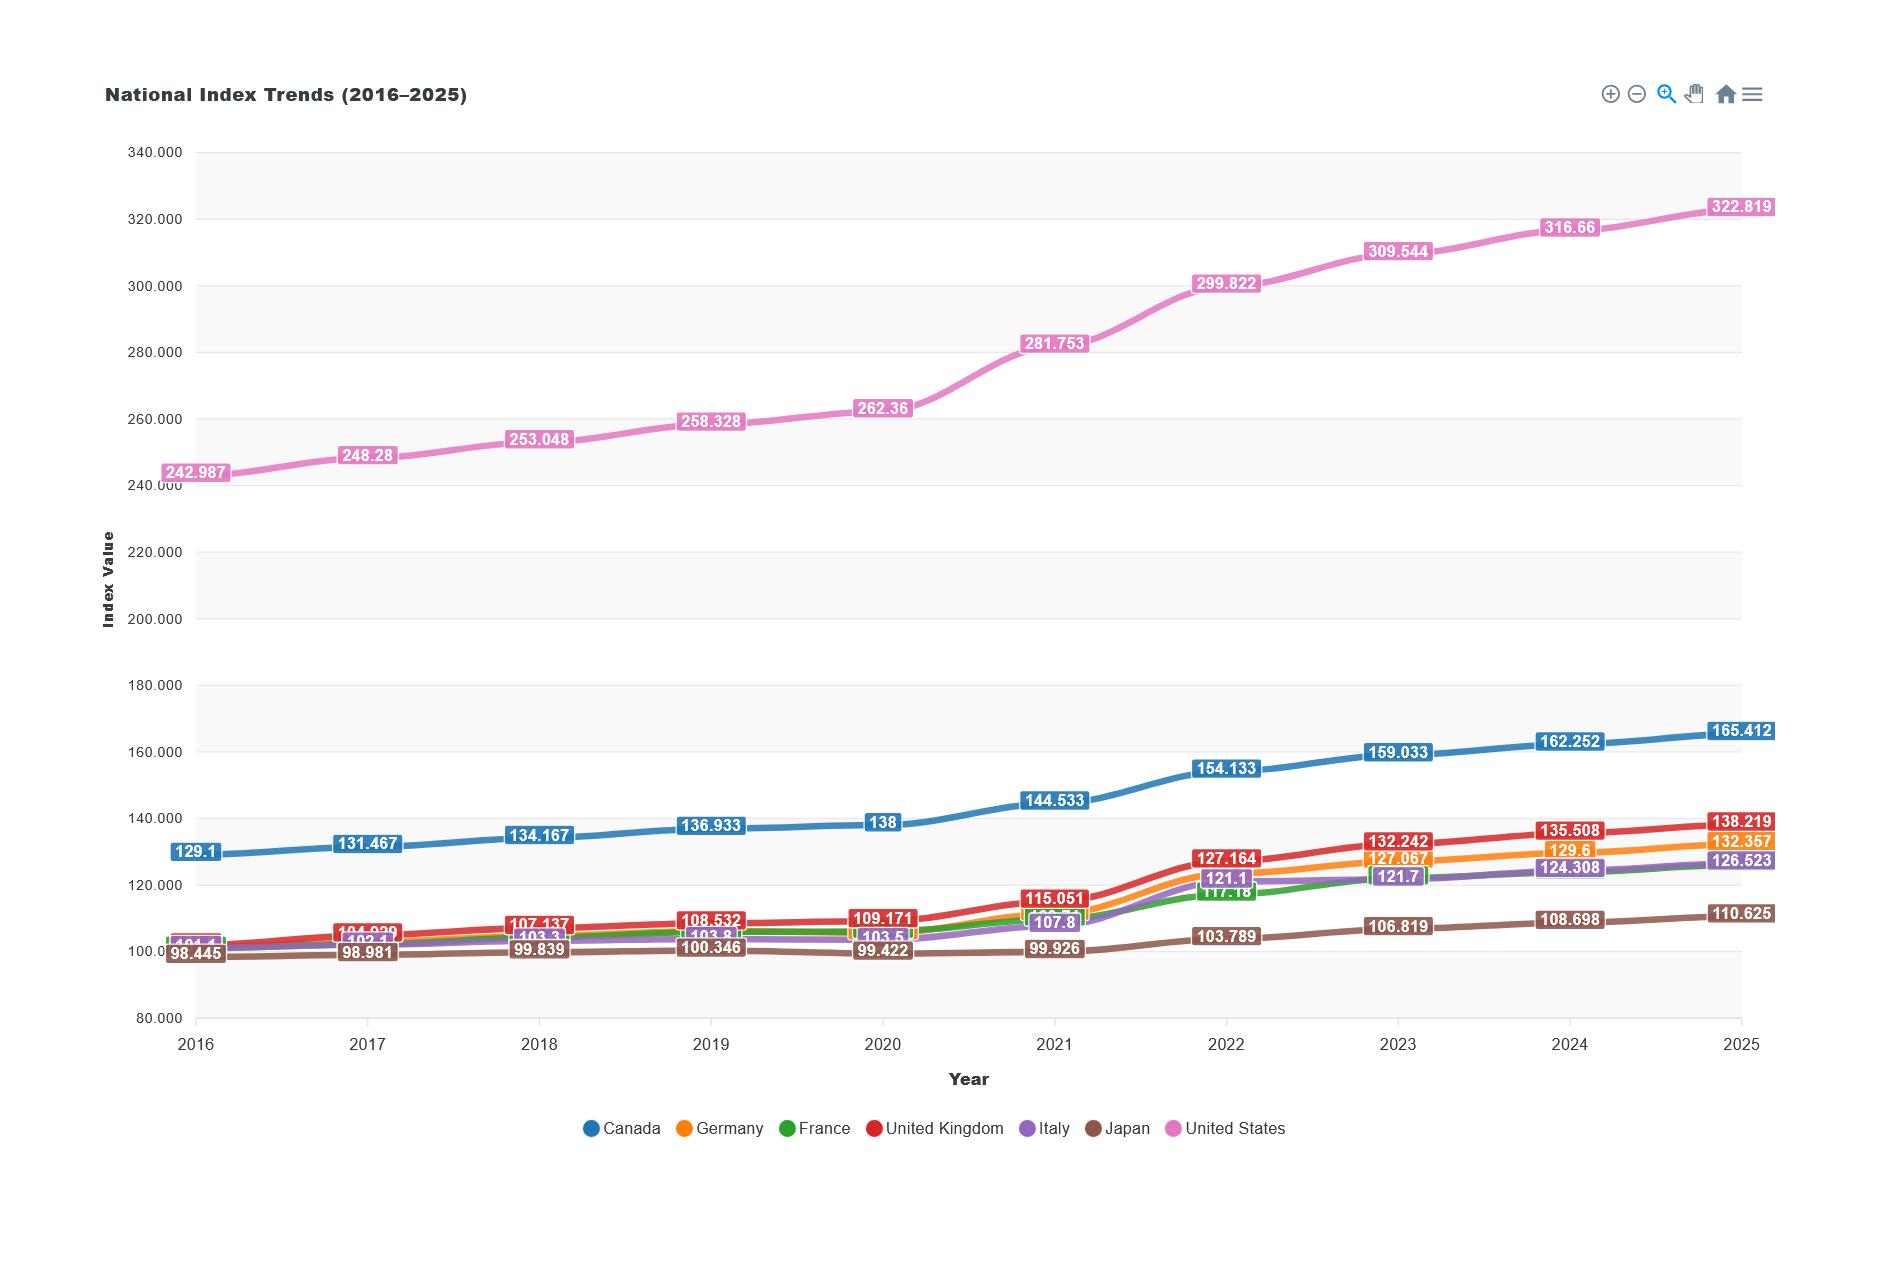
GDP Per Capita Over Time – Developed Countries 2020 to 2024
This dashboard presents GDP per capita trends in developed countries from 2020 to 2024, offering a year-by-year view of economic performance on an individual level. It captures how different nations navigated challenges such as the COVID-19 pandemic, inflation, and shifting global markets. By comparing changes over time, the data reveals patterns of recovery, resilience, and growth. Use this dashboard to explore how income levels evolved, and how economic strategies influenced the financial well-being of populations across high-income nations.
- For some countries, 2023 data is used for 2024 if no data was available for 2024
Conclusion
The success of the Nordic countries in achieving high social well-being metrics, despite their challenging climates and high tax rates, can be attributed to the strategic use of tax revenue to fund robust social policies. These policies, including a strong social safety net, work-life balance, equality, and high-quality public services, create an environment where citizens thrive.
This comprehensive approach not only elevates the standard of living but also fosters a sense of community and trust, further enhancing the well-being of these societies. As a result, the need for emigration from these regions has decreased, reflecting the stability and quality of life that their social systems provide.