
Clothing Prices and Economics: Trends, Consumption, and Textile Waste in OECD Countries (1975–2025)
March 2, 2025
The modern wardrobe tells a complex economic story. While we have more clothes than ever before, the relationship between purchasing power, clothing prices, and consumption patterns has fundamentally shifted over the past 50 years. This analysis examines clothing price trends, the factors driving these changes, and what happens to our excess clothing in OECD countries.
The clothing industry presents a fascinating economic paradox. Unlike most consumer goods, clothing prices have generally decreased in real terms (adjusted for inflation) from 1975 to around 2010, then reversed course in the last decade.
| Time Period | Clothing Price Change (Real Terms) | Key Drivers |
|---|---|---|
| 1975-1990 | Moderate increase (+2-3% annually) | Domestic production, higher labor costs |
| 1990-2010 | Significant decrease (-1-2% annually) | Globalization, offshore manufacturing |
| 2010-2025 | Slight increase (+10-15% nominal) | Raw material costs, supply chain disruptions, rising wages |
50 Years Ago (1975) vs Today:
10 Years Ago (2015) vs Today:
The most significant factor in clothing price changes has been the shift from domestic to international production:
| Production Era | Primary Locations | Labor Cost Impact | Price Effect |
|---|---|---|---|
| 1970s-1980s | USA, Europe, Japan | High wages, strong unions | Higher prices |
| 1990s-2000s | China, Southeast Asia | Low wages, minimal regulations | Dramatic price drops |
| 2010s-2020s | Bangladesh, Vietnam, India | Ultra-low wages | Continued low prices |
| 2020s-Present | Diversification + automation | Rising wages in traditional locations | Moderate price increases |
Cotton Production vs Demand:
Petroleum-Based Products Impact:
| Technology Advancement | Impact on Costs | Timeline |
|---|---|---|
| Automated cutting systems | -15-20% labor costs | 1990s-2000s |
| Digital printing | -30% setup costs | 2000s-2010s |
| AI-driven design | -25% development time | 2010s-2020s |
| 3D knitting machines | -40% waste reduction | 2020s-Present |
| Country | Per Capita Spending (USD) | % of Household Income | Kg of Textiles Used |
|---|---|---|---|
| United States | $1,200 | 3.2% | 34 kg |
| Germany | $900 | 2.8% | 26 kg |
| United Kingdom | $1,100 | 3.5% | 26 kg |
| France | $800 | 2.5% | 24 kg |
| Japan | $650 | 2.1% | 18 kg |
| Canada | $1,050 | 3.1% | 30 kg |
| Australia | $1,150 | 3.4% | 32 kg |
| Netherlands | $750 | 2.4% | 22 kg |
| Sweden | $700 | 2.2% | 20 kg |
| Denmark | $650 | 2.0% | 19 kg |
| Country | Clothing Affordability Index* | Price Change (10 years) | Consumption Growth |
|---|---|---|---|
| United States | 145 | +12% | +35% |
| Germany | 128 | +8% | +25% |
| United Kingdom | 138 | +15% | +40% |
| France | 125 | +10% | +28% |
| Japan | 118 | +5% | +15% |
| Canada | 142 | +11% | +32% |
| Australia | 148 | +13% | +38% |
| Netherlands | 135 | +9% | +30% |
| Sweden | 132 | +7% | +22% |
| Denmark | 130 | +6% | +20% |
*Index: 100 = baseline affordability in 2015
The increase in purchasing power and decrease in relative clothing costs has led to unprecedented consumption levels. But what happens to all these clothes when we’re done with them?
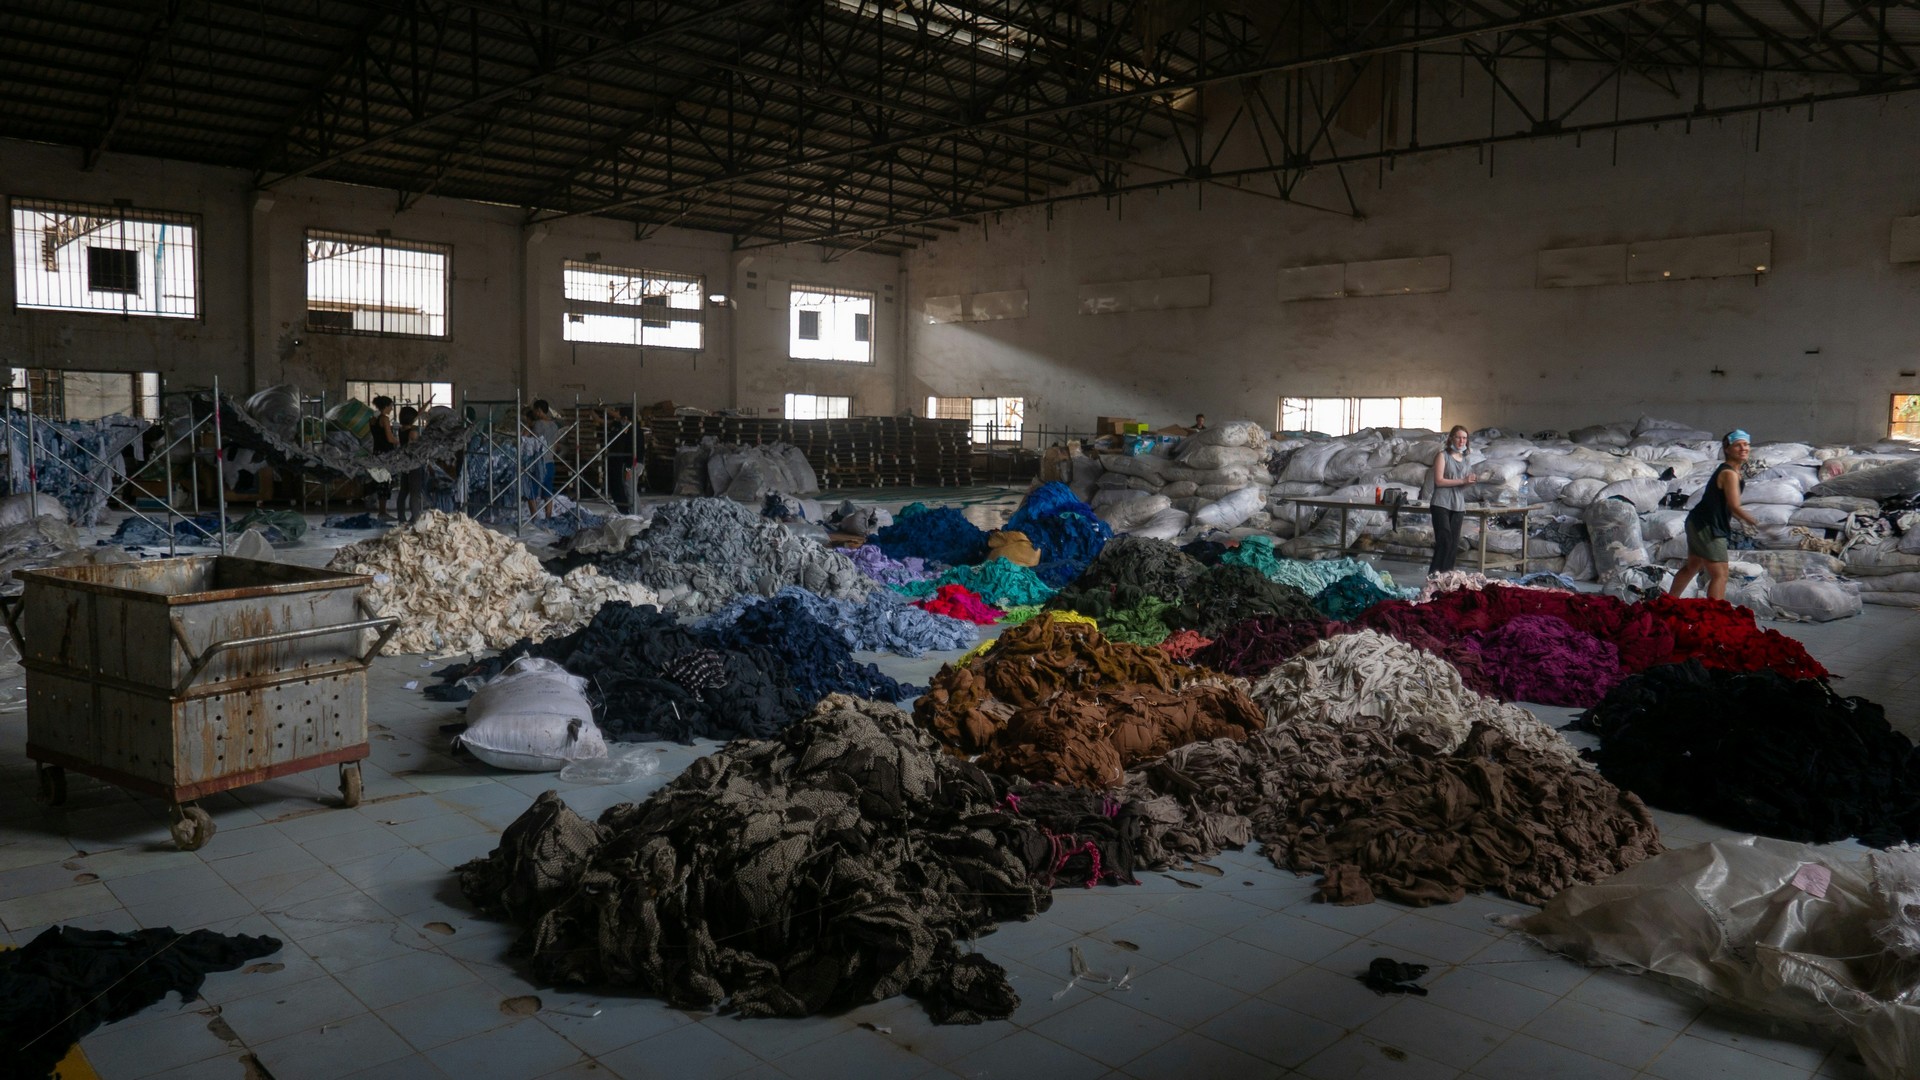
The scale of textile waste is staggering and rapidly growing. Approximately 92 million tonnes of textile waste are produced globally each year, with projections indicating this will reach 134 million tonnes by 2030 if current consumption trends continue. This represents one of the fastest-growing waste streams in the world.
EU-Specific Data (2020):
| Country | Charity/Reuse (%) | Recycling (%) | Landfill (%) | Incineration (%) | Export (%) |
|---|---|---|---|---|---|
| United States | 15% | 13% | 65% | 5% | 2% |
| Germany | 35% | 20% | 25% | 15% | 5% |
| United Kingdom | 25% | 18% | 40% | 12% | 5% |
| France | 30% | 22% | 35% | 10% | 3% |
| Japan | 20% | 25% | 45% | 8% | 2% |
| Canada | 18% | 15% | 60% | 5% | 2% |
| Australia | 22% | 16% | 55% | 4% | 3% |
| Netherlands | 40% | 25% | 20% | 12% | 3% |
| Sweden | 45% | 30% | 15% | 8% | 2% |
| Denmark | 42% | 28% | 18% | 10% | 2% |
| Country | Collection Rate (%) | Actual Recycling Rate (%) | Fiber-to-Fiber Recycling (%) |
|---|---|---|---|
| United States | 25% | 14.7% | 1% |
| Germany | 75% | 45% | 3% |
| United Kingdom | 50% | 35% | 2% |
| France | 60% | 40% | 2.5% |
| Japan | 45% | 38% | 4% |
| Canada | 30% | 20% | 1.5% |
| Australia | 35% | 22% | 1% |
| Netherlands | 80% | 50% | 4% |
| Sweden | 85% | 55% | 5% |
| Denmark | 82% | 52% | 4.5% |
A troubling pattern has emerged in the global second-hand clothing market: donated clothes from countries like Australia are exported to Europe, while local retailers simultaneously import similar second-hand items back. This circular inefficiency highlights the lack of coordination in textile waste management and underscores the need for better support from local governments to develop domestic reuse markets.

Charity and Reuse (15-45% of discarded clothes):
Recycling (13-30% of discarded clothes):
Landfill and Incineration (50-80% of discarded clothes):
| Country | Waste Management Cost (USD per capita) | Landfill Costs | Recycling Infrastructure Investment |
|---|---|---|---|
| United States | $45 | $35 | $10 |
| Germany | $75 | $20 | $55 |
| United Kingdom | $55 | $25 | $30 |
| France | $60 | $22 | $38 |
| Japan | $65 | $18 | $47 |
| Canada | $50 | $32 | $18 |
| Australia | $52 | $28 | $24 |
| Netherlands | $85 | $15 | $70 |
| Sweden | $90 | $12 | $78 |
| Denmark | $88 | $14 | $74 |
In 2025, the European Union implemented groundbreaking Extended Producer Responsibility regulations for textile producers and fashion brands. This represents the most significant policy shift in textile waste management to date.
Key Components:
This policy shift is expected to fundamentally alter production incentives, encouraging brands to design for longevity rather than disposability.
The clothing industry represents a unique economic phenomenon where technological advancement, globalization, and exploitation of low-cost labor have created a perfect storm of affordability. While general inflation has increased prices across most sectors, clothing has become progressively more affordable, leading to unprecedented consumption levels.
The combination of increased purchasing power and decreased clothing prices has created a consumption cycle that OECD countries are struggling to manage. With just 12% of the material used for clothing ends up being recycled globally, the majority of our clothing purchases ultimately contribute to environmental waste.
The 2025 EU Extended Producer Responsibility regulations represent a watershed moment for the global textile industry. By making producers financially responsible for their products’ entire lifecycle, these policies could fundamentally shift industry incentives from volume-based to sustainability-focused business models.
However, the challenge remains immense. With textile waste projected to reach 134 million tonnes annually by 2030, and only 1% currently being recycled into new fibers, the industry needs rapid transformation. The international trade inefficiencies – where clothes are simultaneously exported and imported between regions – highlight the need for coordinated global policy approaches.
Nordic countries and Germany continue to lead with the highest collection rates (80%+ in some cases), but even these leaders achieve minimal true recycling. The data reveals that policy intervention and infrastructure investment can significantly improve collection outcomes, but breakthrough technologies and design approaches are needed to close the loop on textile waste.
As we move forward, the clothing industry must grapple with the true cost of cheap fashion – not just in terms of environmental impact, but also in developing sustainable business models that don’t rely on excessive consumption to remain profitable.